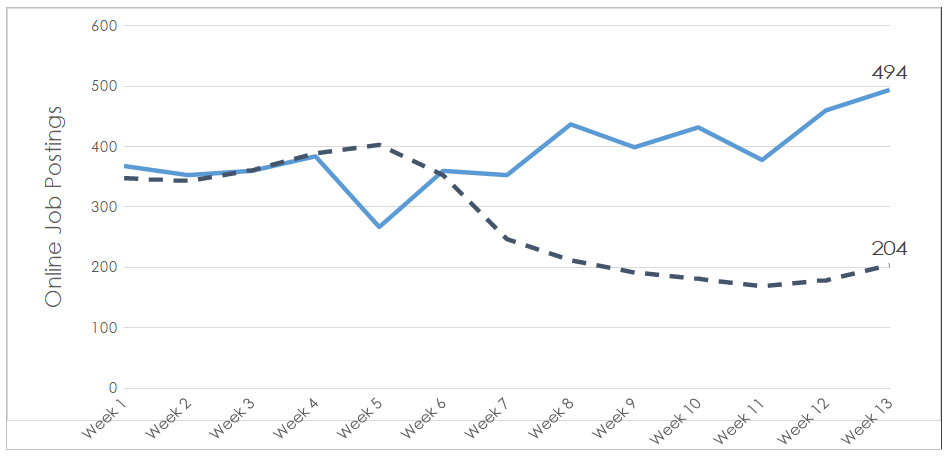
This briefing note continues NWPB’s ongoing efforts to understand how the COVID-19 pandemic is affecting local job demand. This document updates our April 17, 2020 briefing note on job demand. This edition examines weekly job demand since the start of the pandemic, as well as offering a more detailed examination of job demand in the month of April 2020.
NWPB’s job demand data is based on the aggregation of online job postings. The reference period for this briefing note begins in the first week of February 2, 2020 and ends with the week of April 26, 2020. Corresponding data from 2019 are presented to show the scope of COVID-19’s impact on job demand. While this method does not reflect all job demand in Niagara (i.e. it cannot track word-of-mouth job demand or recruiting through private job boards) it remains a useful indicator of general trends within the local labour market.
As noted in our previous report, week-over-week job demand trends began to change during the week of March 15, 2020 (Week 7 in the table below). In 2019, Week 7 to Week 13 (i.e. mid-March to the end of April) there was a weekly average of 421 new job posts. During the same reference period in 2020, the weekly average was 197 job posts. This represents a 53.1% decline in the annual weekly average between 2019 and 2020. April, however, did see steady week-over-week increases in job demand. The week of April 26, 2020, saw the most job demand of any week in April. However, job demand in this week was 58.7% less than what was observed in during the same week in 2019. These data give provide a clear illustration of how the pandemic has affected Niagara’s typical seasonal job demand.

The following table compares April of 2019 to April of 2020, with a particular focus on the major occupation groups in demand. Although business closures had an impact across all sectors, the pandemic’s impact on job demand for sales and service occupations is the most pronounced in both absolute and proportional terms.
Jobs in sales and service occupations represent approximately 85.2% of total jobs in the accommodation and food services industry and 64.9% of all jobs in the retail trade industry.[1] Since these two industry sectors were among those most impacted by business closures in Ontario, it follows that job demand for sales and service staff would be similarly affected. The only occupation group that saw an increase in April of 2020 was health occupations.
| Occupation | April 2019 | April 2020 | Percentage Change |
|---|---|---|---|
| Sales and service occupations | 795 | 191 | -76.0% |
| Trades, transport and equipment operators and related occupations | 149 | 79 | -47.0% |
| Health occupations | 72 | 78 | 8.3% |
| Business, finance and administration occupations | 195 | 61 | -68.7% |
| Occupations in education, law and social, community and government services | 109 | 59 | -45.9% |
| Natural and applied sciences and related occupations | 67 | 48 | -28.4% |
| Management occupations | 107 | 36 | -66.4% |
| Unclassified occupation | 37 | 19 | -48.6% |
| Occupations in manufacturing and utilities | 39 | 17 | -56.4% |
| Occupations in art, culture, recreation and sport | 29 | 11 | -62.1% |
| Natural resources, agriculture and related production occupations | 20 | 11 | -45.0% |
| Total | 1,619 | 610 | -62.3% |
Additional data from April 1, 2020 to April 30, 2020 capture the specific occupations that represented at least 2.5% of total job demand for the month.
| Occupation | Job Postings | Percentage |
|---|---|---|
| Home support workers, housekeepers and related occupations | 38 | 6.2% |
| Registered nurses and registered psychiatric nurses | 36 | 5.9% |
| Food counter attendants, kitchen helpers and related support occupations | 29 | 4.8% |
| Licensed practical nurses | 20 | 3.3% |
| Cashiers | 20 | 3.3% |
| Retail salespersons | 18 | 3.0% |
| Other customer and information services representatives | 17 | 2.8% |
| Bus drivers, subway operators and other transit operators | 16 | 2.6% |
| Food service supervisors | 16 | 2.6% |
The majority of the job postings in the home support workers, housekeepers, and related occupations group were for positions within long-term care and residential care facilities. This finding reflects the considerable pressure that the COVID-19 pandemic has created on Ontario’s long-term care system. Similarly, job demand for registered nurses and registered psychiatric nurses as well as licensed practical nurses was divided between positions with the Niagara Health System and positions with a variety of long-term care providers.
Many of the food counter attendant positions were for positions within long-term care facilities. The remaining were primarily found within franchise fast food and coffee restaurants. Cashier positions were almost exclusively for positions in grocery stores; the only exceptions were for positions in drug stores and pharmacies and one position in a hardware store.
What to do in Uncertain Times
Individuals experiencing employment disruptions, as well as employers who are still looking to hire, can access resources and support from Niagara’s Employment Ontario service providers. Contact information for a service provider near you can be found through this link.
For all other inquiries please contact Vivian Kinnaird.
[1]: EMSI Analyst, Niagara Census Division, 2019.3 dataset.