This monthly update to the Employment Prospect Series provides an overview of new job opportunities in the Niagara region. These jobs are categorized into the level of education that is typically required for these jobs; this definition is based on Statistics Canada’s National Occupational Classification matrix, 2016.[1]
This update also takes into account local context and provincial responses/policy changes made in response to the COVID-19 pandemic. In May of 2020, provincial emergency orders were extended until at least June 9. Provincial policy changes also included notices that some businesses would be allowed to reopen throughout early-mid May which coincides with the first 4 weeks in this report.
This update outlines new online job posts for the 5 weeks following the April Employment Prospects Series update, which covered March 31 – April 25, 2020. Specifically, these data show jobs posted between April 26 – May 30, 2020.
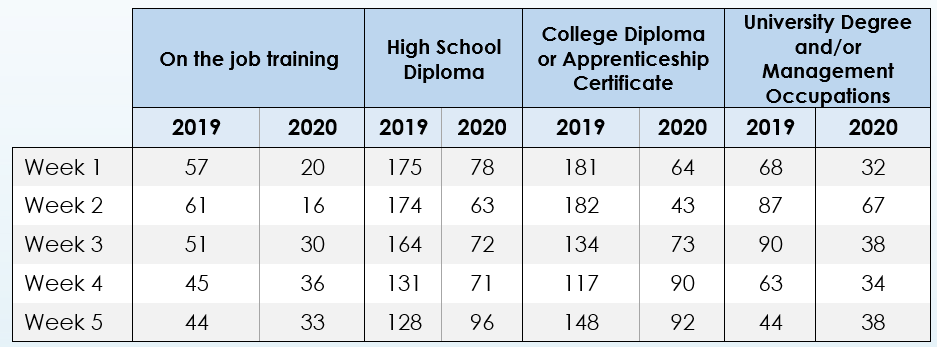
Table 1 shows that, across each level of required educational attainment, job demand was much lower throughout these five weeks in May 2020 when compared to the same time frame in 2019.
Table 1: New Online Job Posts, Niagara, May 2019 and 2020
Though job demand throughout May 2020 was lower than in 2019, it is important to note that there were new job opportunities being posted by employers. Table 2 outlines the top jobs that were posted and their level of required education.
Table 2: Top 5 In-Demand Jobs by Required Level of Education, May 2020
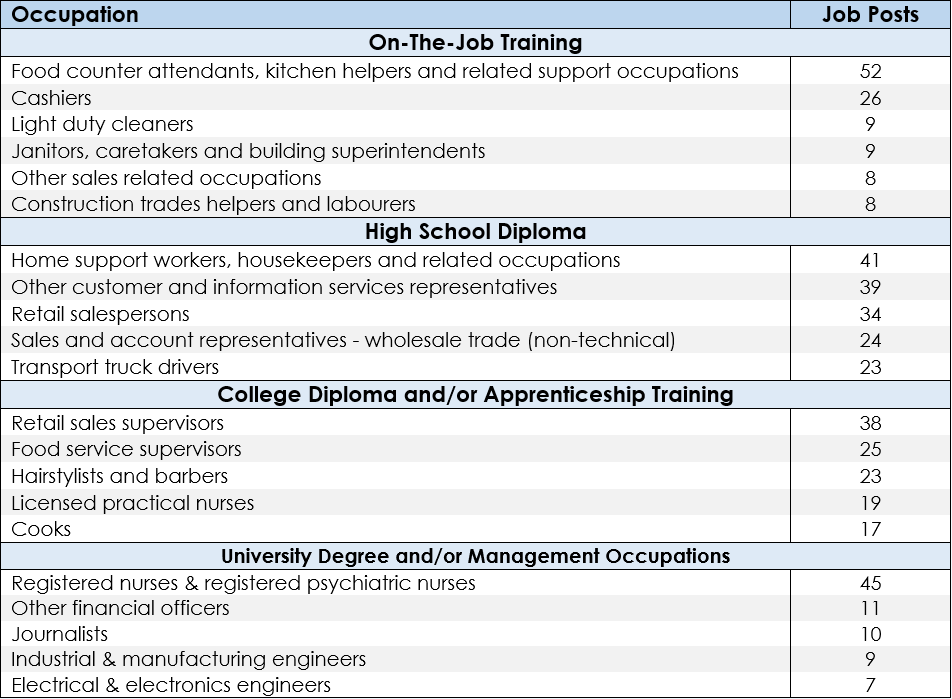
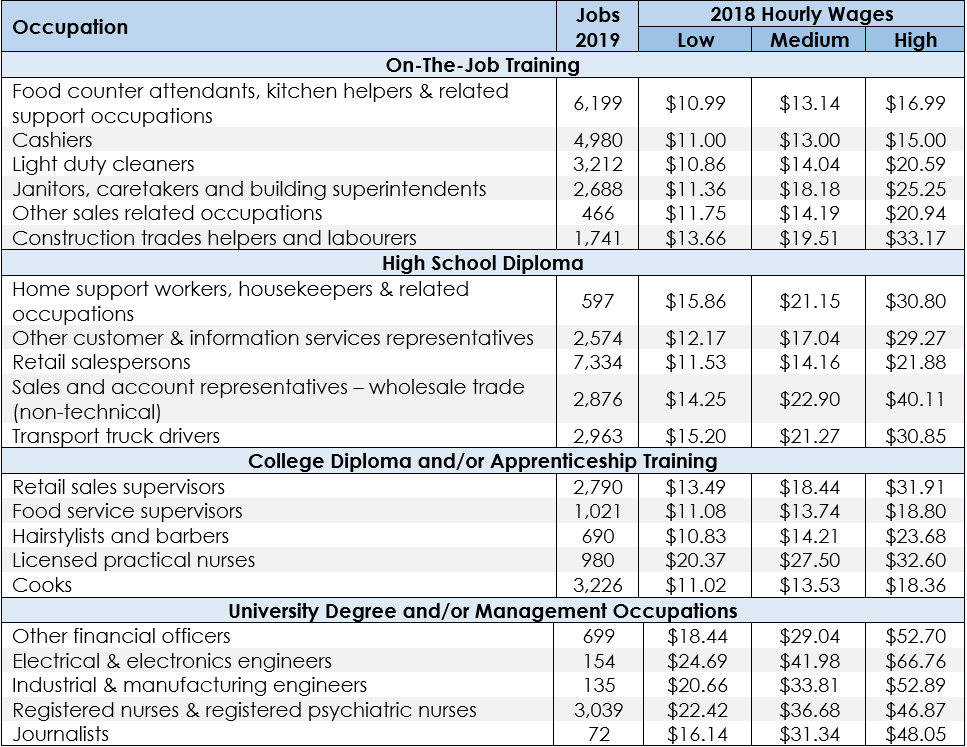
Table 3 outlines the number of jobs that existed in Niagara for each of these top occupations and the estimated hourly wage ranges for 2018. Note that these data do not reflect any changes or impacts from COVID-19. Hourly wages below minimum wage likely reflect part-time work as our data source uses average annual incomes to produce its hourly estimates.
Table 3: 2019 Job Counts and 2018 Hourly Wages, Niagara
All previous monthly reports are available on NWPB’s website. NWPB also produces quarterly reports alongside our monthly reports. The quarterly reports provide provincial-level benchmarks for job counts and trends of job growth and decline. It is our hope that these reports will support Niagara’s residents who are looking to enter the workforce or grow their career. If there is a specific occupation of interest to you, or if you have a question beyond the data represented in this report, please contact NWPB’s CEO, Vivian Kinnaird.
[1]: http://cnp.edsc.gc.ca/English/NOC/Matrix2016.aspx?ver=06%u2282%3D0