This edition of the Eye on Employment is released as Niagara continues to operate in stage 3 of pandemic recovery. During these times, NWPB has attempted to offer as much context as possible on Niagara’s changing employment patterns. All of our insights and efforts to support Niagara during these times can be found through our COVID-19 portal.
Across Canada, August of 2020 saw an additional 219,900 (seasonally unadjusted) employed individuals compared to July of 2020. August is the fourth consecutive month to see national employment gains since the beginning of the pandemic. It remains important to understand that changes in employment do not directly correlate to job creation. Data from the Labour Force Survey measures employment changes within the workforce, itself. The extent to which COVID-19 created job losses or gains, be they temporary or permanent, cannot be determined from this data.
Niagara enjoyed increases in employment between July and August of 2020. August’s data report 9,200 individuals gaining employment in Niagara. Compared to this time last year, however, the current data show 16,100 fewer employed Niagara residents. As such, the region remains heavily impacted by after effects of the COVID-19 pandemic. Ongoing support for employers and job seekers amid the pandemic can be accessed through Niagara’s Employment Ontario network. Please click this link for a list of Niagara’s employment service providers.
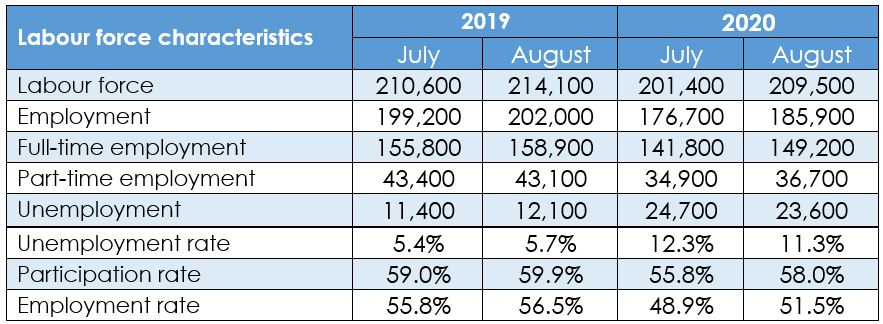
Table 1: Niagara – Current and Historical Trends – Seasonally Unadjusted
A note on our data source: Statistics Canada uses a three-month floating average to produce its monthly data at a regional level. This process typically controls for the volatility inherent to small sample sizes. Ideally, it ensures that an anomaly in a single employment sector in a single month does not have a disproportionate impact on all regional data. With respect to August’s data, we can expect that employment trends from June and July’s data will have an impact on the current figures. Nonetheless, these data remain the best indicator of local employment trends and a firm foundation for future analysis and benchmarking.
Month-over-month data show that 9,200 more people were working in August 2020 compared to July 2020. At the same time, there were 1,100 fewer unemployed people in Niagara. These changes account for decreases in Niagara’s unemployment rate (11.3% in August, down from 12.3% in July) and increases in both the participation rate (58.0% in August, up from 55.8% in July) and the employment rate (51.5% in August, up from 48.9% in July). Generally, decreases in the unemployment rate occurring alongside increases in participation and employment represent an ideal state of affairs for a local labour market. While these data represent a positive trend, they do not represent a return to pre-pandemic levels.
Comparing August 2020 to August 2019 demonstrates the continuing impact of COVID-19 on the local labour force. Compared to this time last year, August 2020 saw 16,100 fewer people in employment – 9.700 of those individuals were in full-time work and 6,400 in part-time work. Similarly, there were 11,500 more unemployed people in August 2020 compared to August 2019.
August’s data saw some improvement in the distribution of employment gains between men and women (note: Statistics Canada’s labour force survey reports gender data between two variables: men and women. This limitation is beyond NWPB’s ability to control or correct.) Among the 9,200 employment gains reported between July and August, 54.3% were among men and 44.6% were among women. This is a move toward parity compared to the June-July data which saw 82.6% of employment gain among men and 18.8% of employment gain among women.
It is important to keep in mind that the data in Table 1 are seasonally unadjusted figures. That means factors such as holidays, seasonality inherent to a given industry, and other factors that can be reasonably predicted to influence employment are not accounted for in these data. Seasonally adjusted data show that there were 8,200 more people employed in Niagara between July and August 2020. This is similar, thought slightly smaller in scale, to the seasonally unadjusted data – which showed an employment gain of 9,200 people.
These gains must also be considered in the context of differences in total employment. When controlling for seasonality, August 2020 saw a total of 182,900 people employed in Niagara. Without controlling for seasonality, there were 185,900 employed people. The difference of 3,000 employed individuals between these two figures can be seen as an impact of seasonality on Niagara’s August employment.
This data suggests that in the absence of seasonal benefits, Niagara’s employment gains would be slightly reduced. Given the impact that COVID-19 has had on employers in terms of reduced staffing, a slow return of customers, and reduced operating capacity amid physical distancing, it remains to be seen how this trend will impact the autumn months, which typically see an extended tourism shoulder season leading into holiday hiring gains.
The Youth Lens
Labour Force Survey data also allow us a snapshot of youth (defined as people age 15 to 24) employment in Niagara. Once again these data do not account for seasonality.
Table 2: Niagara – Current and Historical Trends – Youth Age 15 to 24 – Seasonally Unadjusted
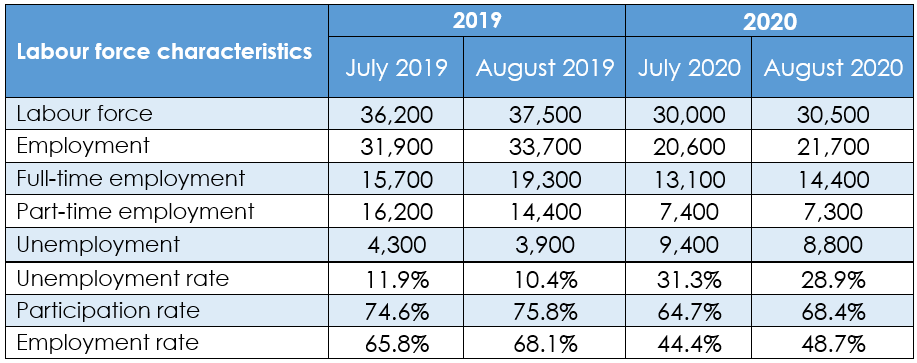
Statistics Canada reports 1,100 more youth working in August 2020 compared to July 2020. August further saw 1,300 more youth working in a full-time capacity and 100 fewer youth working in a part-time capacity (note: the incongruous arithmetic in these data is the result of rounding on the part of Statistics Canada).
August 2020 saw a decrease in the youth unemployment rate (28.9% in August, down from 31.3% in July). This was accompanied by month-over-month increases in the youth participation rate (68.4% in August, up from 64.7% in July) and an increase in the youth employment rate (48.7% in August, up from 44.4% in July). Once again, increases to employment and participation rates amid a declining unemployment rate is generally a positive indicator. These data indicate that youth are seeing some success in their employment searches. As noted with the general labour force data, short-term successes should not overshadow the long-term challenges; specifically, current youth unemployment levels are nearly triple what they were in August 2019.
Sectoral Shifts
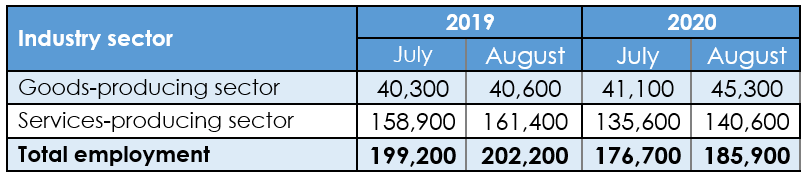
Table 3 offers additional insight into the changing employment patterns within Niagara’s major industry sectors. These data reflect month-over-month employment gains for both the goods- and services-producing sectors in Niagara. August of 2020 saw an additional 4,200 people in employment in the goods-producing sector, and an additional 5,000 people in employment in the services-producing sector. While these figures are below those that were observed in July and August of 2019, they reflect the third month of total employment growth in Niagara since the start of the pandemic.
Table 3: Niagara – Employment Sectors – Monthly and Annual Data
Recognizing that monthly industry data from the Labour Force Survey can be volatile and prone to shifts, the August 2020 data show a range of employment gains and losses across multiple sectors.
Table 4: Niagara – Detailed Employment Sectors – Monthly Data
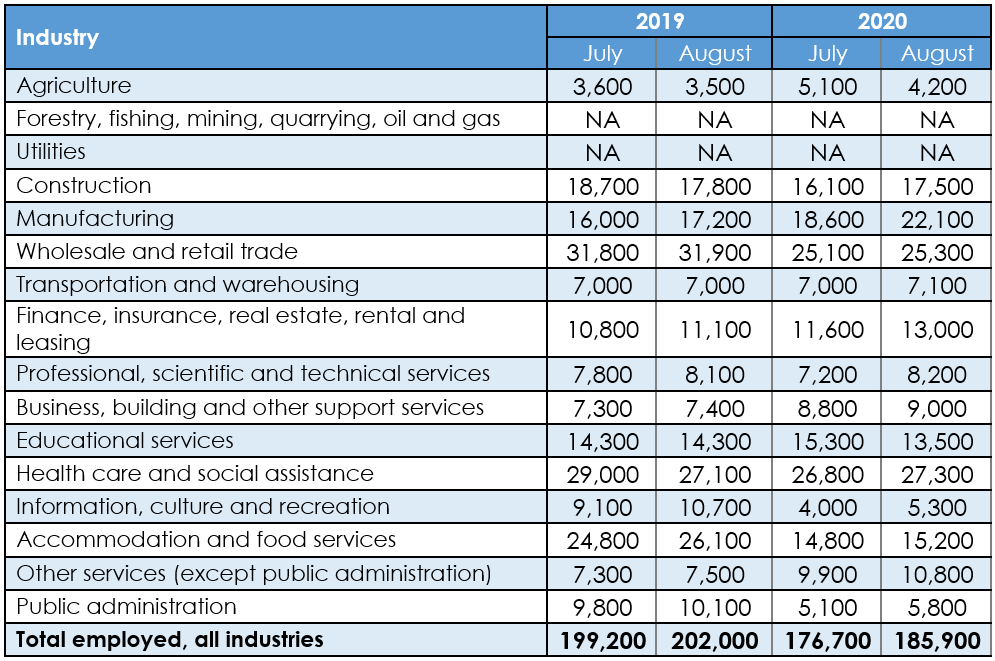
Within the goods-producing industries, month-over-month data show 3,500 more people employed in manufacturing in August of 2020 and 1,400 more people employed in construction. The services-producing sector saw some notable increases, with an additional 1,300 people employed in information, culture and recreation between July and August 2020. As Niagara operated in stage 3 of pandemic recovery, employment in wholesale and retail trade increased slightly with 200 additional people reporting employment.
Niagara’s employment in education services saw the largest decline of all industries, with 1,800 fewer people in employment. Summer months likely had some impact on this sector.
We now offer the Eye on Employment in a downloadable PDF format. You can download the PDF by clicking this link.
Would you like to know more? NWPB is ready for your questions. Reach out to NWPB’s CEO, Vivian Kinnaird.