This briefing note is part of a series on COVID-19 and its impact on the retail trade sector. This note provides an outline on characteristics of the retail trade workforce and the predominant jobs in Niagara’s retail sector. Other briefing notes in this series focus on retail trade employers, the link between retail trade in Niagara and the tourism sector, COVID-19 impacts on employment in retail, and insights on what a post-pandemic reality might take for Niagara’s retail trade sector.
Demographic Data
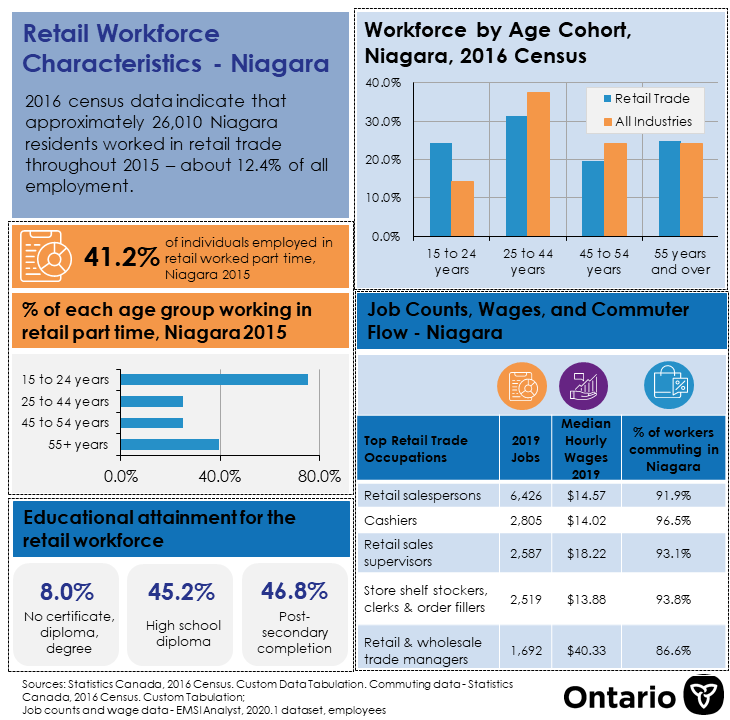
Much of the data available on characteristics of Niagara’s resident retail workforce come from the 2016 census[1]. According to these data, there were approximately 26,010 Niagara residents reporting employment in the retail trade industry; this was approximately 12.4% of employment among all Niagara residents. Compared to other industry sectors, retail trade sector relied more heavily on a youth workforce. Specifically, 24.2% of people who worked in retail trade were aged 15 to 24; only 14.3% of the total workforce, however, were aged 15 to 24 (see Table 1).
Table 1: Workforce by age cohort, Niagara residents, 2016 Census
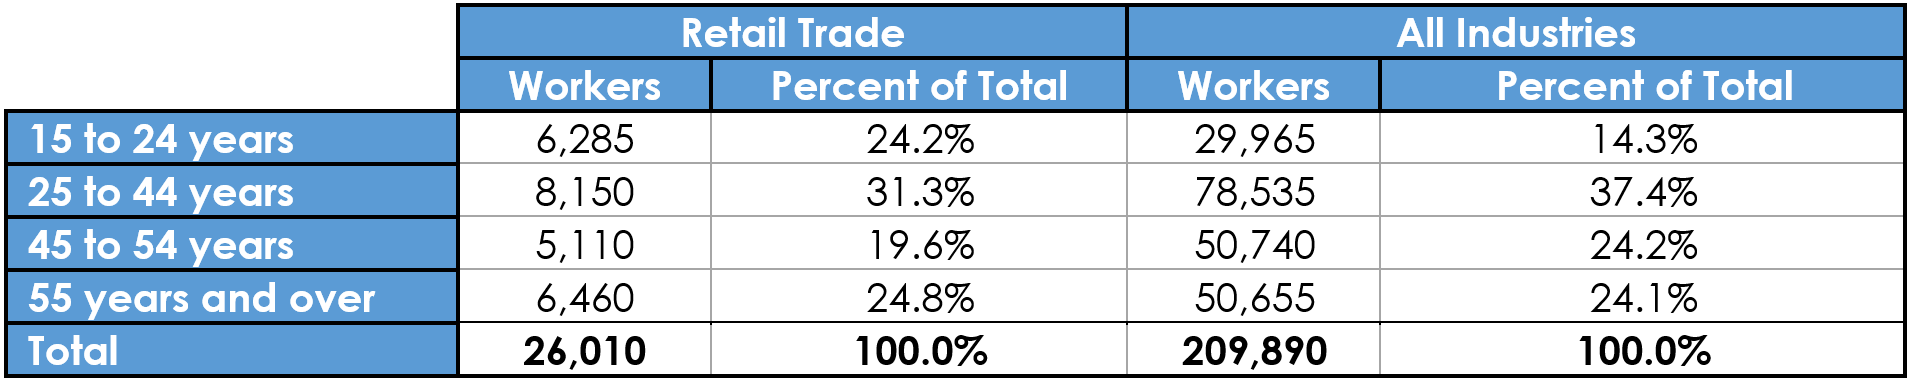
Overall, 41.2% of individuals reporting employment in the retail trade sector reported working part-time. Among all other industries, only 23.5% of Niagara’s residents were employed in a part-time capacity (see Figure 1). These data show that, across all age groups, individuals employed in the retail trade industry are more likely to work part-time than their counterparts in other industries.
Figure 1: Percentage of each age group working part time, Niagara, 2016 Census
Educational Attainment
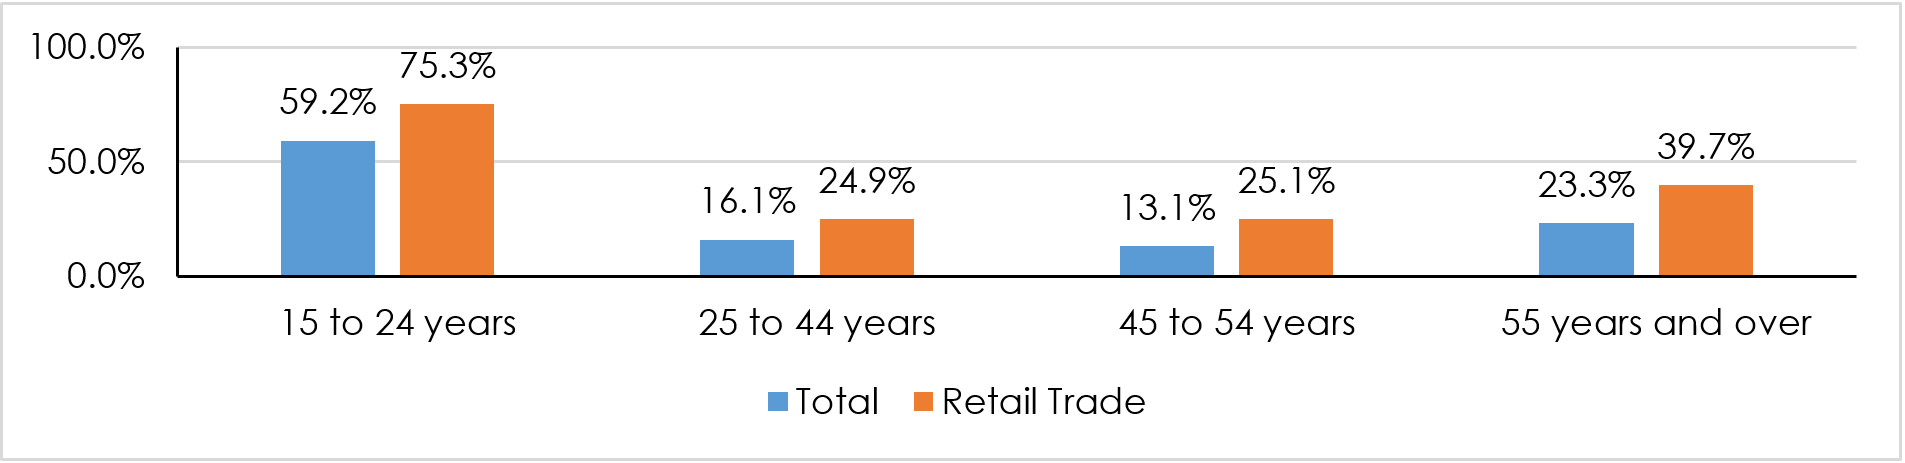
Census data also demonstrate that individuals working full time in retail trade report lower levels of post-secondary education completion. Approximately 8.0% of full-time retail trade employees have no certificate, diploma or degree compared to 6.6% of Niagara’s entire full-time labour force. Moreover, 45.2% of full-time retail trade employees have a high school diploma as their highest level of educational attainment compared to 28.9% of Niagara labour force; 46.8% of Niagara’s full-time retail employees have a postsecondary certificate, diploma, or degree, compared to 64.5% of Niagara’s labour force (see Table 2).
Table 2: Educational attainment for Niagara’s labour force working full time, 2016 Census
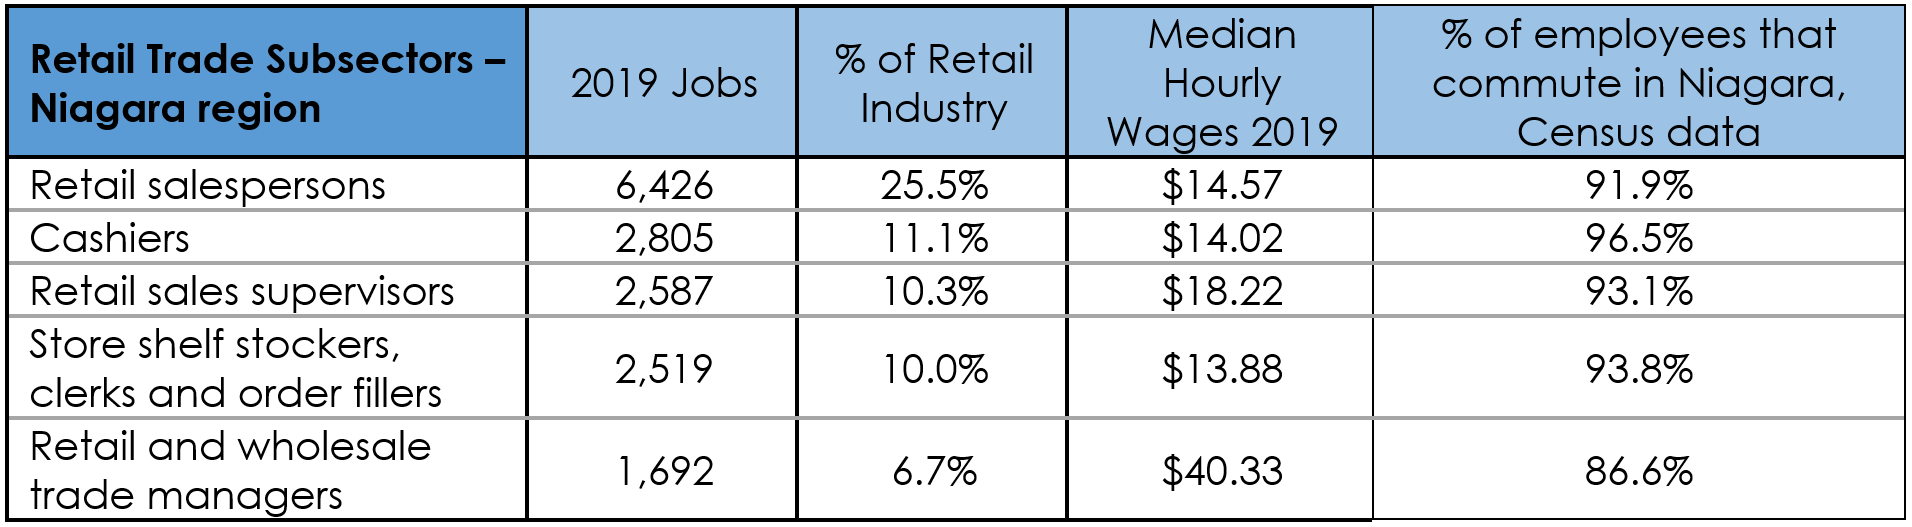
Commuting and wages
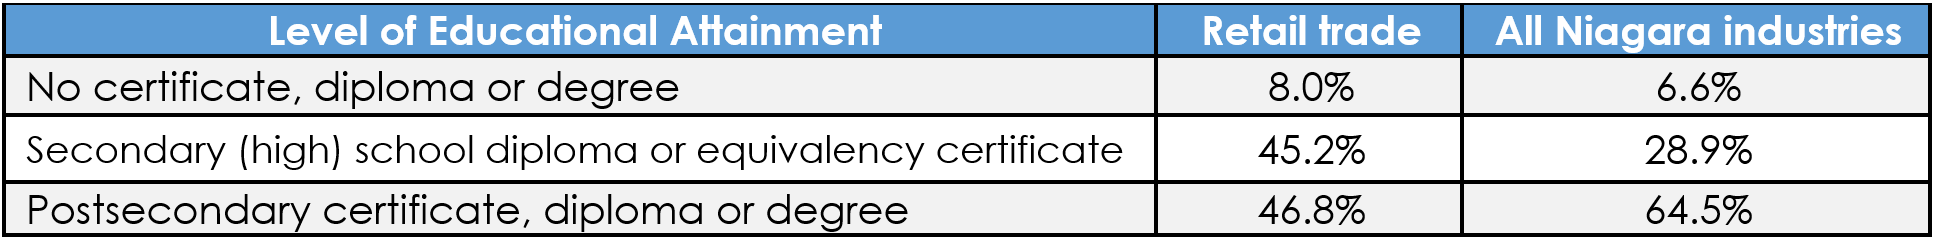
Niagara residents – regardless of occupation – are unlikely to commute out of the region, with 84.5% of those employed in 2015 commuting within Niagara. Table 3 presents data on the top-five occupations in the retail trade industry by number of jobs in 2019. It also includes median hourly wages from 2019. The median wages for the four most prevalent occupations show that those employees tend to be working either at or near minimum wage, or in a part-time capacity. It also shows the percentage of Niagara residents employed in those occupations who commute to work within Niagara’ according to census data. Notably, all five of the occupations had rates of commuting within Niagara of over 86%.
Table 3 Commuter and wage data for retail trade occupations, Niagara region
Our first report on the general impacts of COVID-19 showed that lower income individuals, youth, and part-time workers are all vulnerable to the negative effects of COVID-19. As the above data show, all three of these demographic groups are heavily represented within the retail trade sector. Further reporting and employer engagement during this project will assess best practices to mitigate these challenges.
[1]: We use data from the 2016 census here because the Labour Force Survey does not allow for breakdowns by local employment, industry, and age cohorts. As such, the most recent relevant data is from the 2016 Census.